
Bike Accidents Around Denver
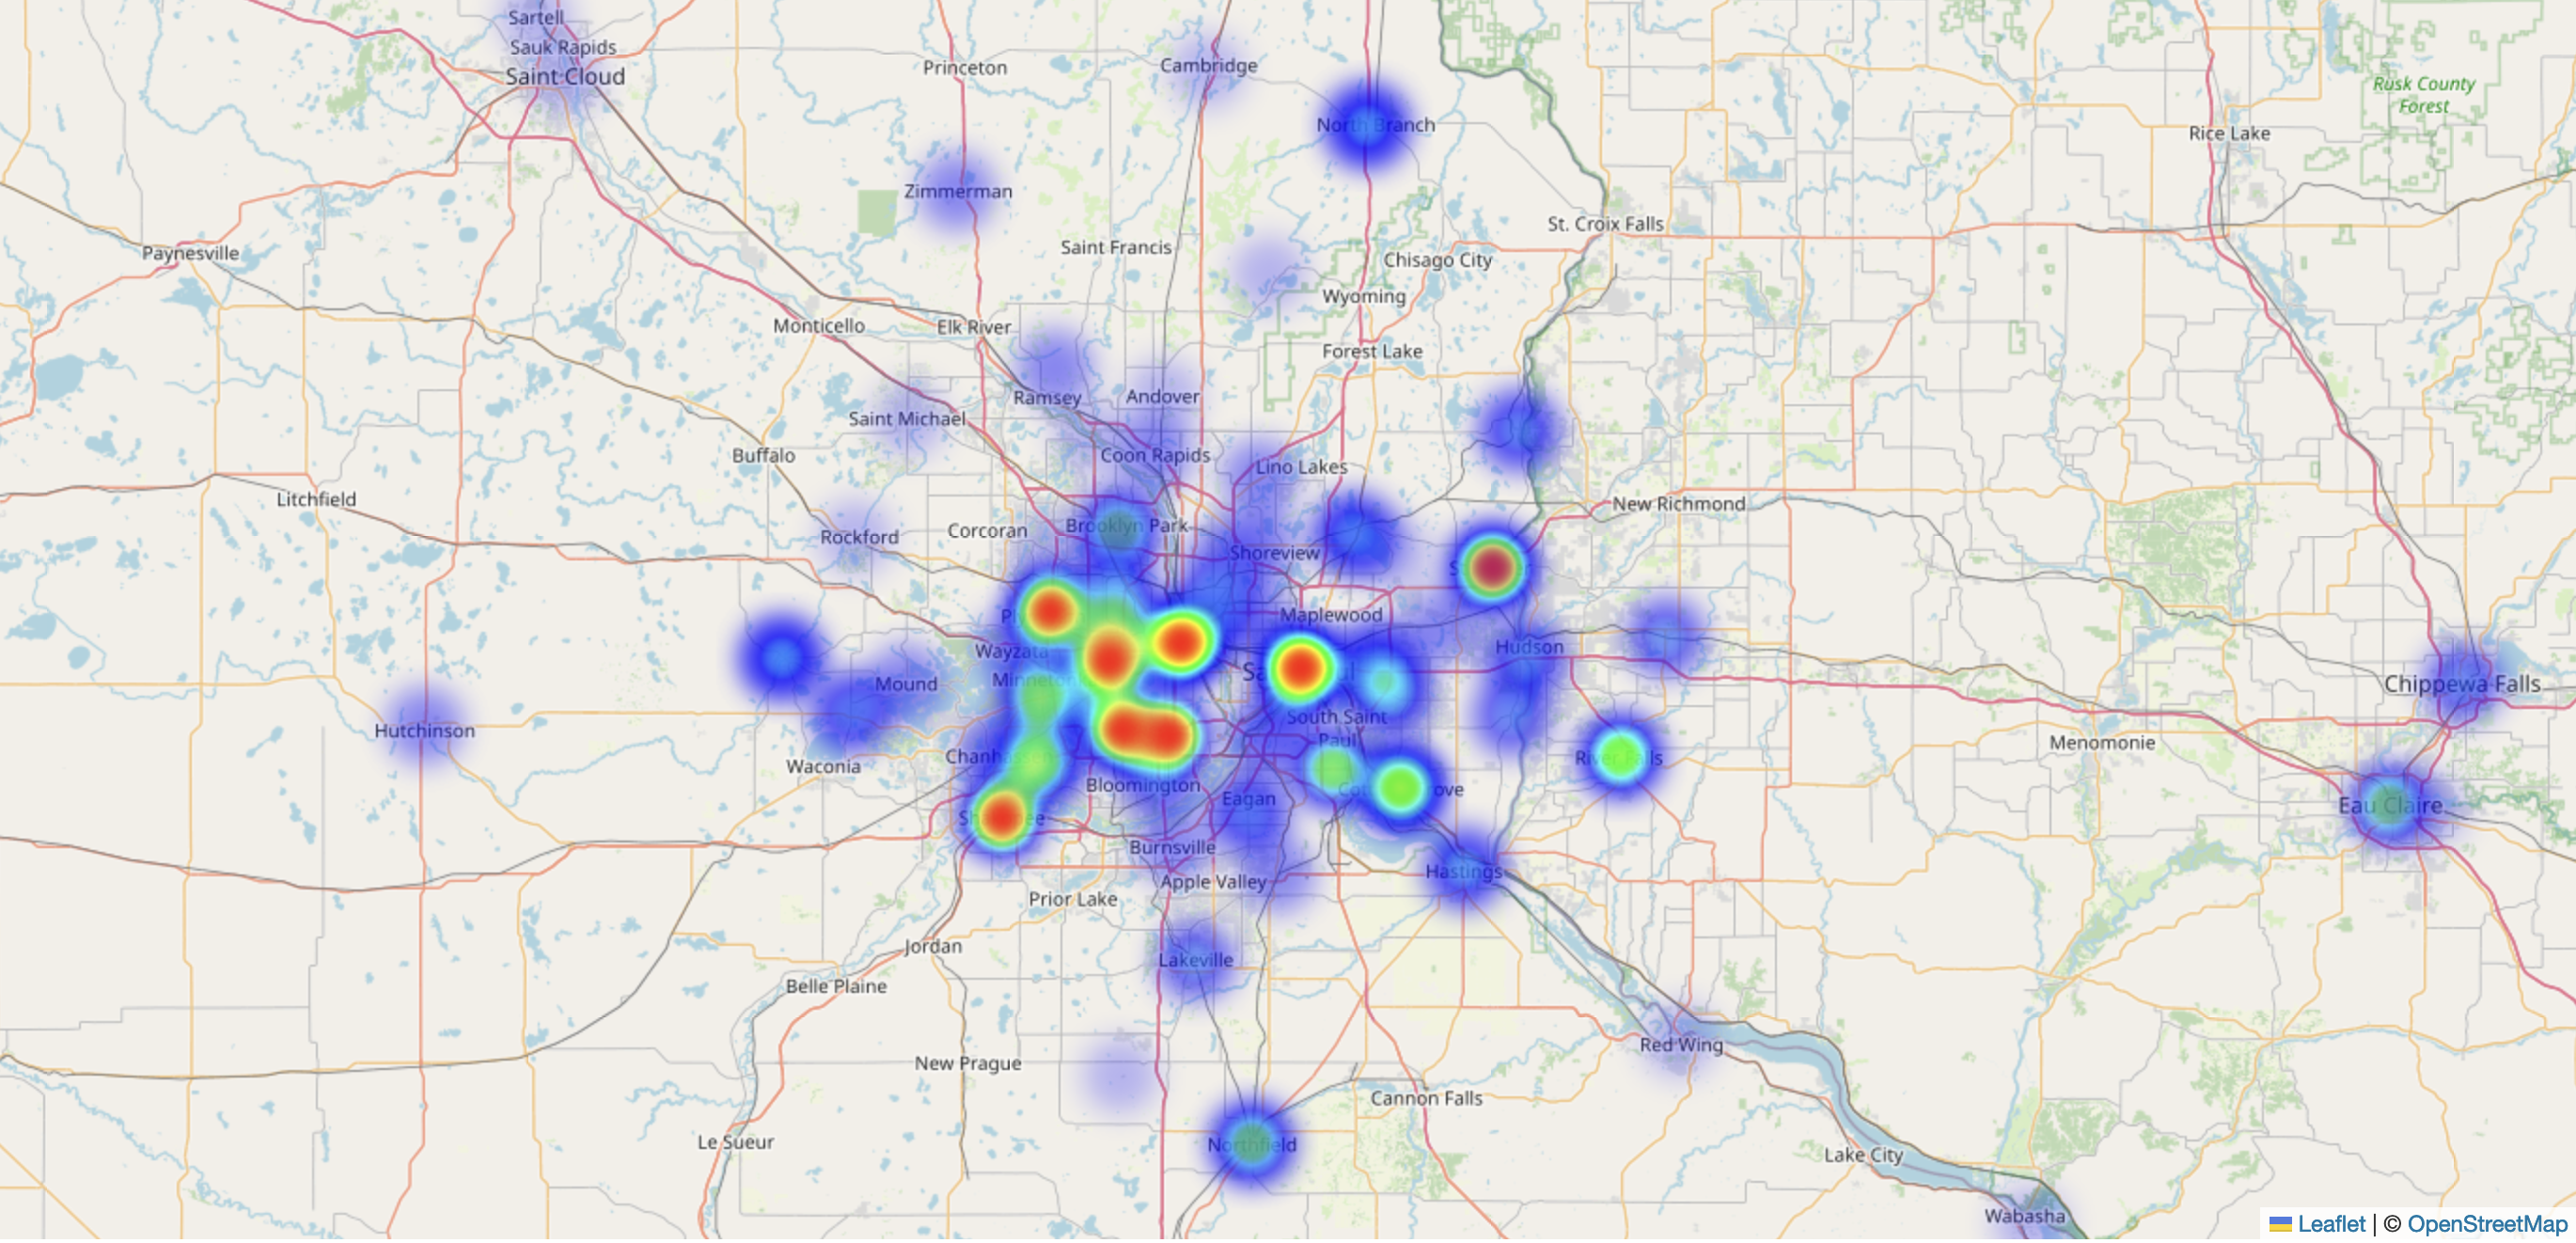
An interactive heat map of Denver bike accidents over time. Thanks to open data initiatives, like the City of Denver Open Data Catalog, we can crunch numbers and see what’s going on in the world around us. This depicts all traffic accidents involving cyclists since 2011 (the beginning of recorded data).
Seems like we average almost 300 a year, so be mindful everyone!
And sorry mobile users, the heat map doesn’t seem to work in mobile browsers. The data is licensed by Denver Gov under CC BY 3.0.

Leave a Comment