
Overview
For about $70 in supplies I built a crank-based power meter. I trained with it for season and it gets the job done! Plus it’s just a fun project.
This article will go through an overview of the hardware, software,
operation, and known pain points opportunities for
improvement. There are more details and gotchas than I can include
here, largely because I was last in the weeds on this more than a year
ago, and that’s what I get for procrastinating.
Or if you wanna cut to it, the code and schematics are all open source on GitHub at https://github.com/stevejarvis/powermeter.
Performance
Overall, this really did work well. It’s within a reasonable margin of error when compared with commercial meters, and usually on the low side. As far as training goes, it’s for certain valuable, because consistency is more important than accuracy (in other words, knowing how hard you’re working and using that to plan over time is more important for progress than whether the real answer was 200 or 210 watts). I tested against commercial meters (by using both at the same time) over these times and durations with these results:
- Wahoo Kickr, the programmed 20 min FTP test. This meter read 9%
lower than the Kickr.

- Computrainer, 40 min at ~190 watts. This meter read 6% higher.

- Favero Assioma Duo, 40 min at ~190 watts. This meter read 6% lower.
I do wish I had the GPX files for each of those A/B comparisons, but I
can’t find them at the moment, so I can only offer my
word. ![]()
Now you data heads out there might point out that the average power is not all that matters, and you’re right. Also that three runs is far from statistically meaningful, and you’d be right again. But beyond just the average reading, the variance within a sustained effort is something I really drilled in on, because it turned out to be a frustrating difference when compared with professional meters. I tracked the variance in readings throughout rides, and this meter is “spikier” than commercial meters. I believe commercial meters apply extra smoothing to the data (this code does very little, and only done in software versus hardware). But maybe more importantly, commercial meters do an exceptional job accounting for the position in the rotation when the reading is taken. For example, if the meter takes a reading during the heat of the down stroke in one revolution, and in the next takes a reading at the apex, that’s going to result in very spiky power over time, when in reality it’s a consistent effort.
This project attempts to handle that issue in software, by calculating
the time for a single revolution and timing the readings such that
they occur at as nearly the same positions in the pedal stroke each
time around. That change resulted in a huge improvement for short term
(<5 second) consistency on power reporting ![]() . It was really
one of those coveted
. It was really
one of those coveted ![]() moments of software engineering, when you
put in heaps of effort analyzing an issue, testing hypotheses, and
then “holy whoa that looks way better!” The hardware
includes a gyroscope, which could be used to dial this in better
still. Basically, it’s an area I gave significant attention, and it’s
one of the points I call out below for future improvement. The
consistency and smoothing is important to get right and a it’s a
difficult problem.
moments of software engineering, when you
put in heaps of effort analyzing an issue, testing hypotheses, and
then “holy whoa that looks way better!” The hardware
includes a gyroscope, which could be used to dial this in better
still. Basically, it’s an area I gave significant attention, and it’s
one of the points I call out below for future improvement. The
consistency and smoothing is important to get right and a it’s a
difficult problem.

The license is GPL, because perhaps my greatest take away from this
project is that this stuff isn’t rocket science and there’s no reason
these meters cost as much as the rest of the bike MIT, because let’s
keep it simple.
The Theory
Basics
Power is a measure of energy, commonly measured in watts, and cycling
is no different: we use the same power rating as light bulbs ![]() . In
traditional physics terms, power is just the rate at which work gets
done. In cycling, that work is the force applied over the circular
distance of the pedal stroke(s), and the rate is the velocity with
which you move the pedals around that circle.
. In
traditional physics terms, power is just the rate at which work gets
done. In cycling, that work is the force applied over the circular
distance of the pedal stroke(s), and the rate is the velocity with
which you move the pedals around that circle.
Force is a vector and can be broken down further into its base components of mass and acceleration, \(kg*{m \over s^2}\). Velocity is also a vector, composed of distance over time, \(m \over s\).
So that boils down to a very short list of raw ingredients needed to make a power calculation:
- Weight on the pedal (the acceleration is that of gravity, and varies so little with elevation we’re assuming a constant).
- Distance the pedals traveled.
- Elapsed time.
Bridging theory over to the real life practice we’re about to do, I think it’s helpful to think of these measurements in two levels of calculations: the first as measured by hardware (including what’s abstracted by the semi-official libraries we’re using for that hardware) and the second is what’s left to us to take care of in our own software. Breaking it down like that, we’ll be handed these pieces straight from the hardware we’re using:
- Circular degrees per second.
- Force.
So all that’s left for us to do:
- Convert degrees per second to meters per second.
- Calculate the power.

The Math
Gyro for Speed
From the gyroscope, we’ll get the rotational velocity in \(deg \over s\), and we want \(m \over s\). For that, we want some helpful definitions and translations to get started. First of all, by definition, a circle is described by:
\(2 * \pi * radian == 360 deg == circumference\)
Derived from that base definition – with minimal magic added – the relationship between radians (\(rad\)) and degrees (\(deg\)) per second is \({deg \over s} * {\pi rad \over 180 deg} = {rad \over s}\), and the ratio of the circumference traveled per second is \(\frac {rad \over s} {2 * \pi}\). So we know how to move from degrees to radians to a percentage of the circumference traveled, and since we know the full circumference of the pedal stroke (counting twice the length of your crank, usually \(m = \frac {172.5mm * 2} {1000mm \over 1m} * \pi\)), we can determine the actual distance traveled.
Putting the above together, we can describe the formula to derive the velocity as \(m \over s\):
\({m \over s} = \frac {\frac {deg} {s} * {\pi \over 180}} {2 * \pi} * 2 * \pi * radius\)
That’s mostly constants, and boils down to simply:
\({m \over s} = {\frac {\frac {deg} {s} * \pi * radius} {180}}\) ![]()
Load Cell for Force
The load cell and associated library make this really simple,
actually. We’ll get Newtons just handed to us. Done. ![]()
Power
There’s only one gotcha with the power, and that’s to double it. Neat trick right? “Coaches hate this one trick: To get stronger just multiply your power by two!” But no, we actually double it because we’re building a one-sided meter here.
\(P = 2* N * {m \over s}\) ![]()
![]()
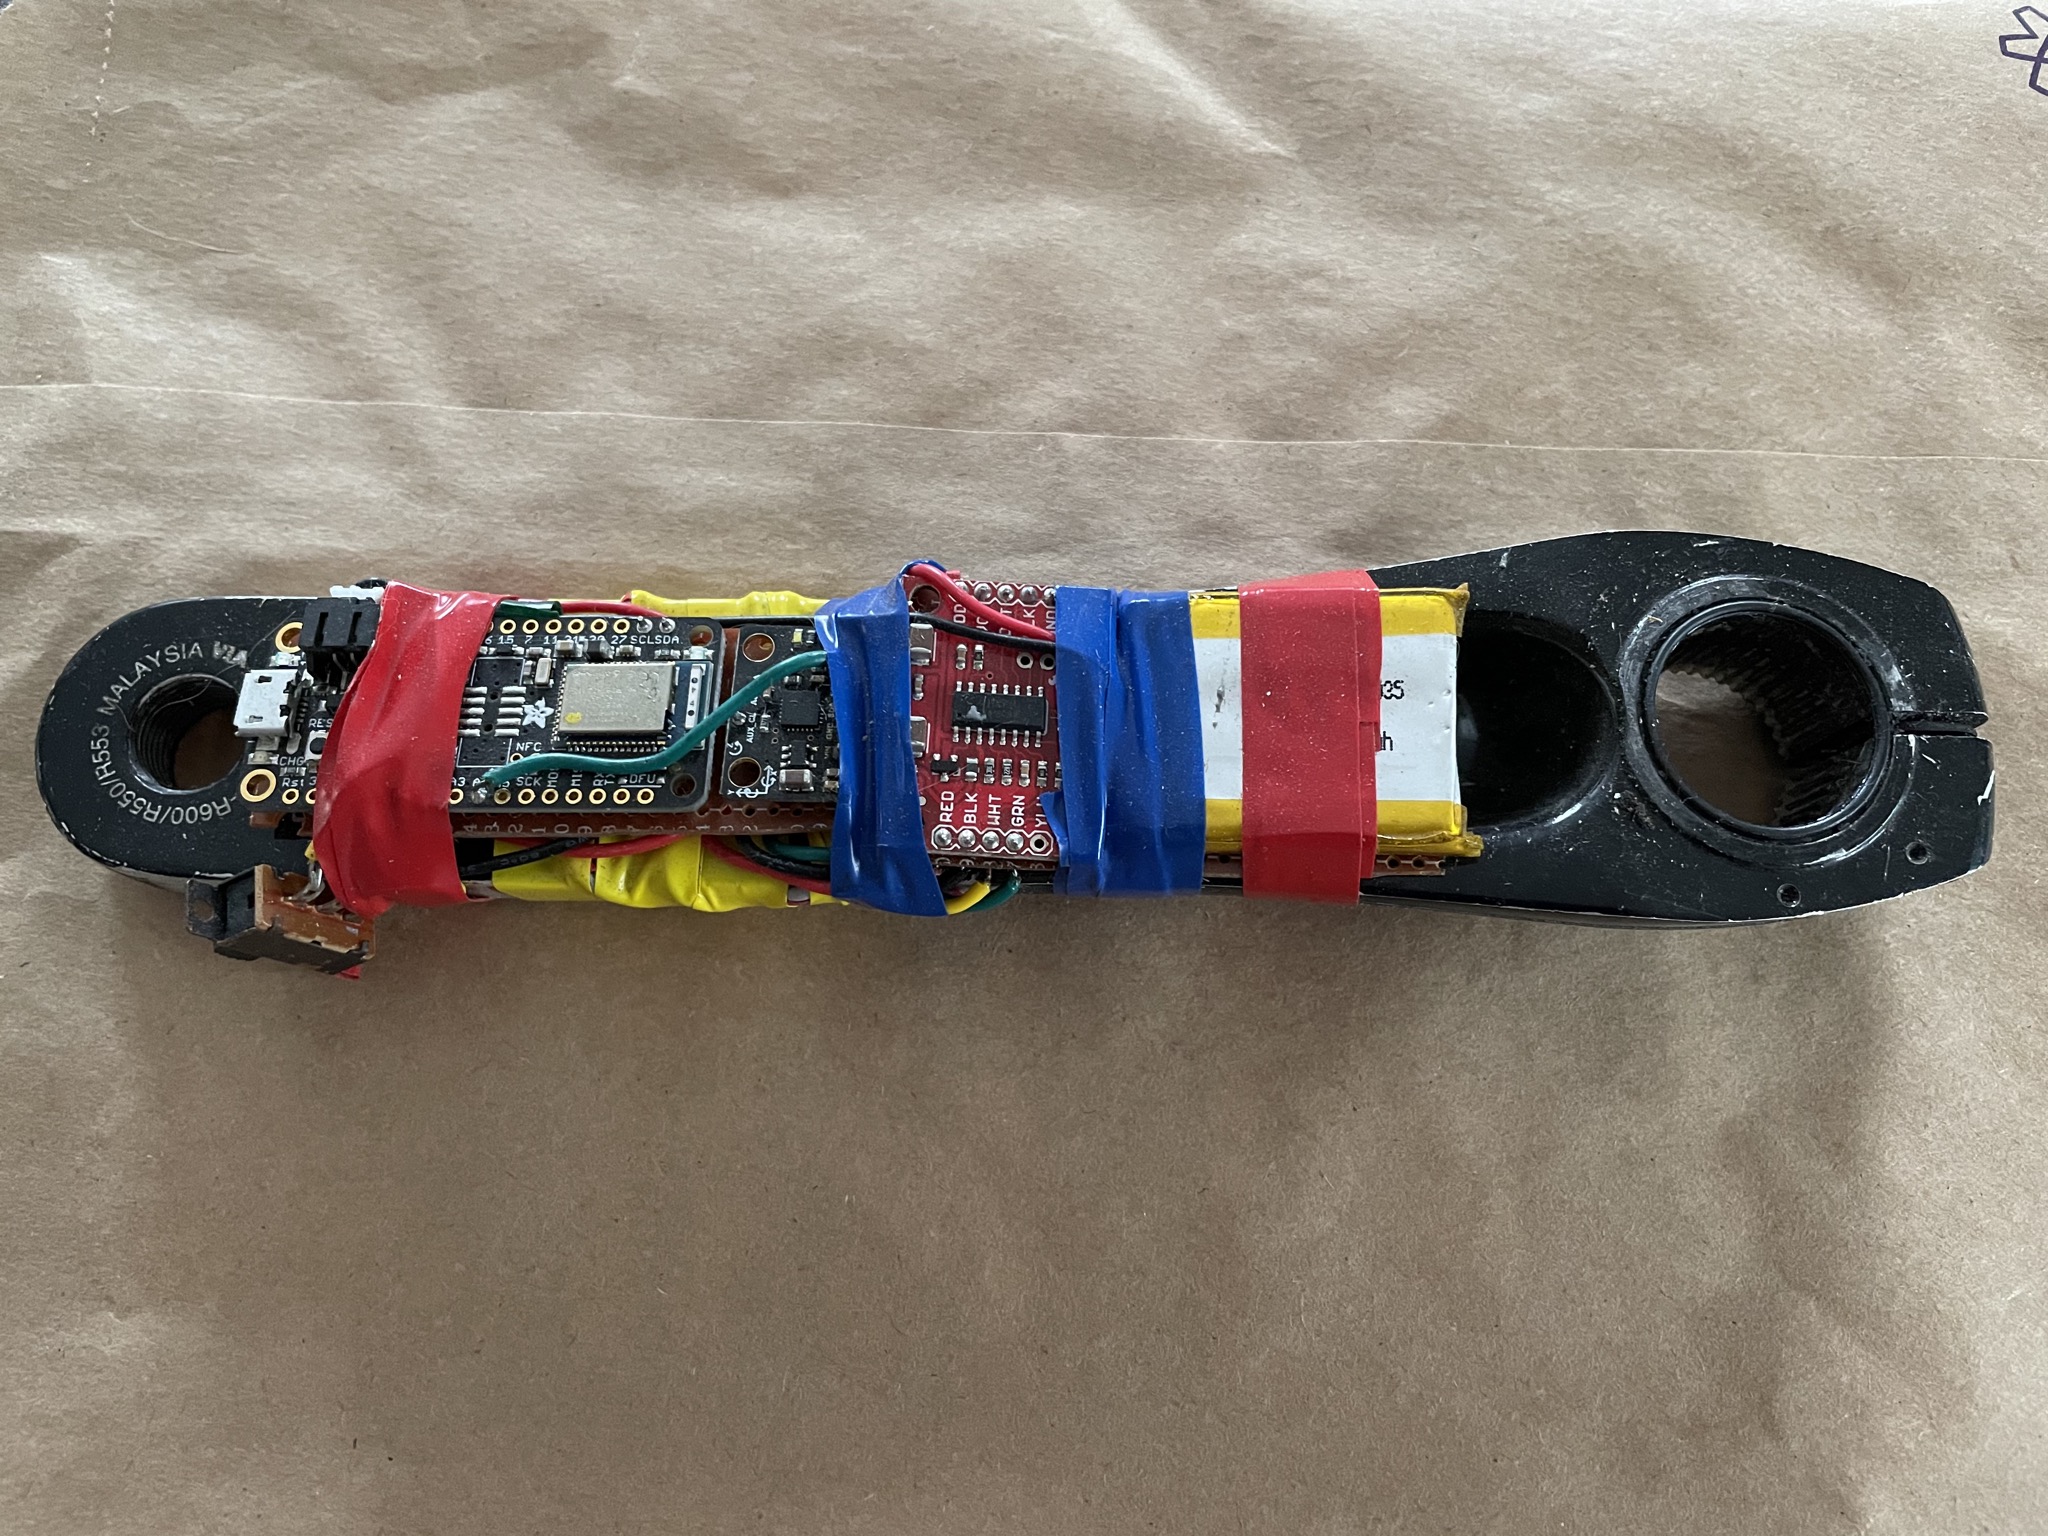
Hardware
Here’s the BOM, with links for the exact models I used. There’s nothing particularly special about these exact products, so if they’re out of stock in one place, try an alternative.
Note: One alternative I recommend you don’t try is the Beetle BLE from DFRobot. It’s probably one of the top results if you search for something like “smallest BLE Arduino controller”, which is attractive because that’s exactly what we want, but it uses a proprietary BLE characteristic that you can’t change. More on Bluetooth below, but it’s a deal-breaker for talking to a commercial bike computer.
- Adafruit Feather nRF52
- HX711 Sparkfun Load Cell Amp
- Adafruit Lithium Ion battery
- Strain gauges
- MPU6050 Gyroscope
The load is measured by detecting resistance differentials in the strain gauges, and the gauges are arranged in a Wheatstone bridge, with two strain gauges on each of the top and bottom of the crank. Such an arrangement makes the force detection resistant to changes based on temperature (because the resistance of each gauge changes proportionally, so the differential is still a reliable measure of force).
Sand off some contact points to glue on strain gauges around mid-crank arm, then break out the soldering iron and connect the dots. The main “gotcha” to keep track of is that this form factor is challenging. With off-the-shelf components, it’s difficult to pack it in tightly enough to clear the limited space between the crank arm and chainstay. And each frame is different. I did fit one of these on three bikes – a Merckx San Remo, a Trek 1000, and my wife’s Orbea Orca – but each one was different enough that it takes a slight variation on the plan. Use thin, flexible wiring, with enough forgiveness to shift things at least slightly (I used 30 gauge wire).
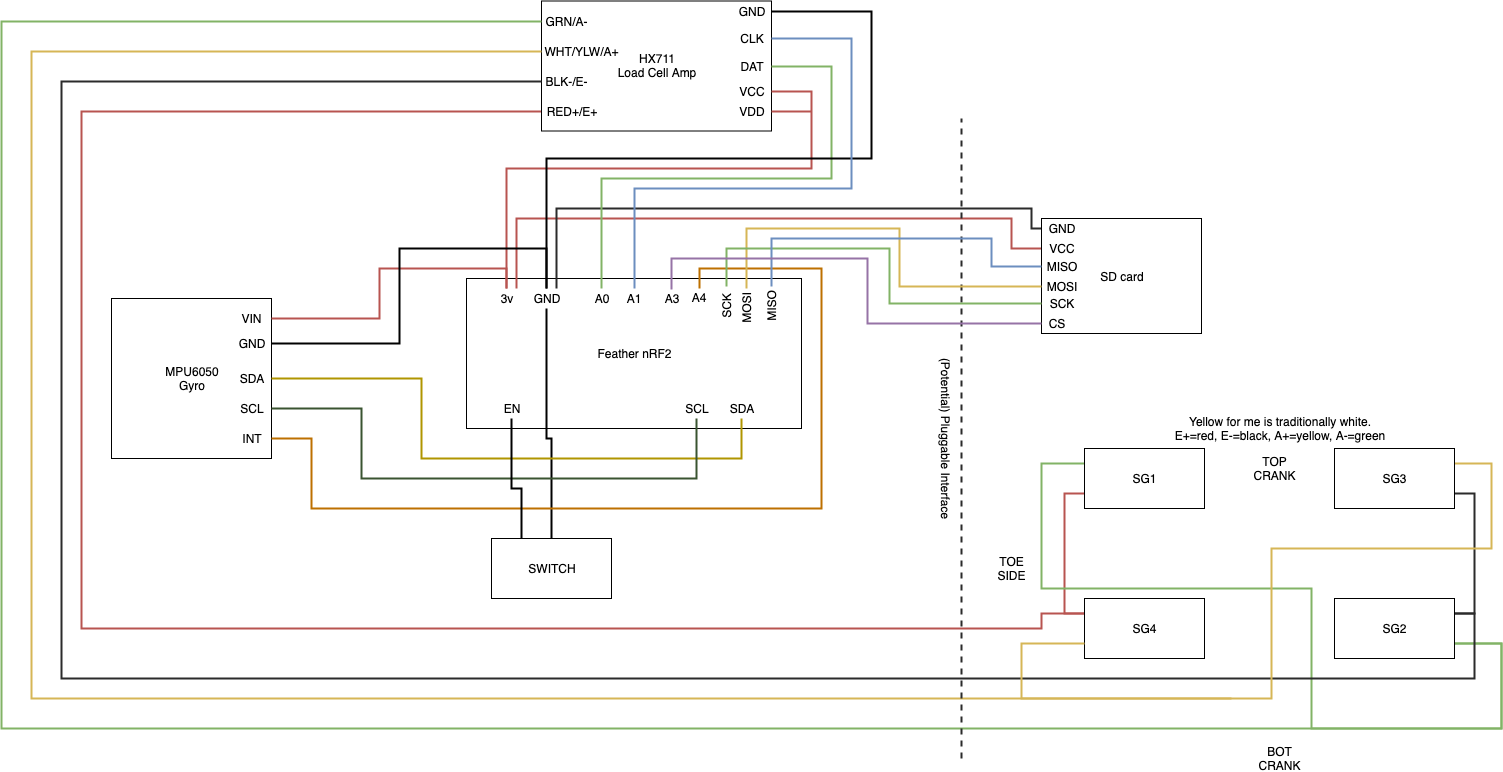
Schematic
Software
This is all open source. The
repository includes the COTS libraries to interact with the hardware
modules, the .ino files are those crafted by me to pull it all
together. It’s not what I’d consider “production quality”, because it
was more of an ongoing science project than anything. The files are
organized by the primary piece of functionality they provide:
-
ble.inohandles the Bluetooth Low Energy communication, sending the power readings to a connected bike computer adherent to the official spec. -
gyro.inohandles gyroscope interaction, doing the calculations for foot speed. Makes use of the COTS libraryMPU6050. -
load_cell.inointeracts with theI2Cdevlibrary to measure the force on the pedal. -
power.inois the main file with the primary runtime loop, tying it all together.
Bluetooth Low Energy
Just a quick call-out that BLE was perhaps the most difficult part to get working. The specs are hard to read for someone unfamiliar (try to find a good overview on the difference between BLE Services and BLE Profiles, we need both), and debugging is hard. Byte ordering doesn’t always match bit endianness, and to set the appropriate flags you absolutely need to flip individual bits. And when it doesn’t work it just… doesn’t… work. I ended up programming an extra central (“server”, in Bluetooth speak) in Python to aid in debugging.
Using It
There’s some finer notes on the project wiki, including instructions to calibrate the meter. But after calibrating, you’re ready to rock. Avoid puddles.
Improvements
If you’re taking on this project, kudos and I’m excited to hear it. Here’s the top things I think need some attention to take this to the next level…
Update! Thijs did a lot of this! So big thanks and kudos to him. Check out the updates in the comments.
1. Calibration
Calibration is a very manual process right now. It’s so tedious it’s really a 2-person job. Basically anything would be an improvement on what it takes to calibrate now.
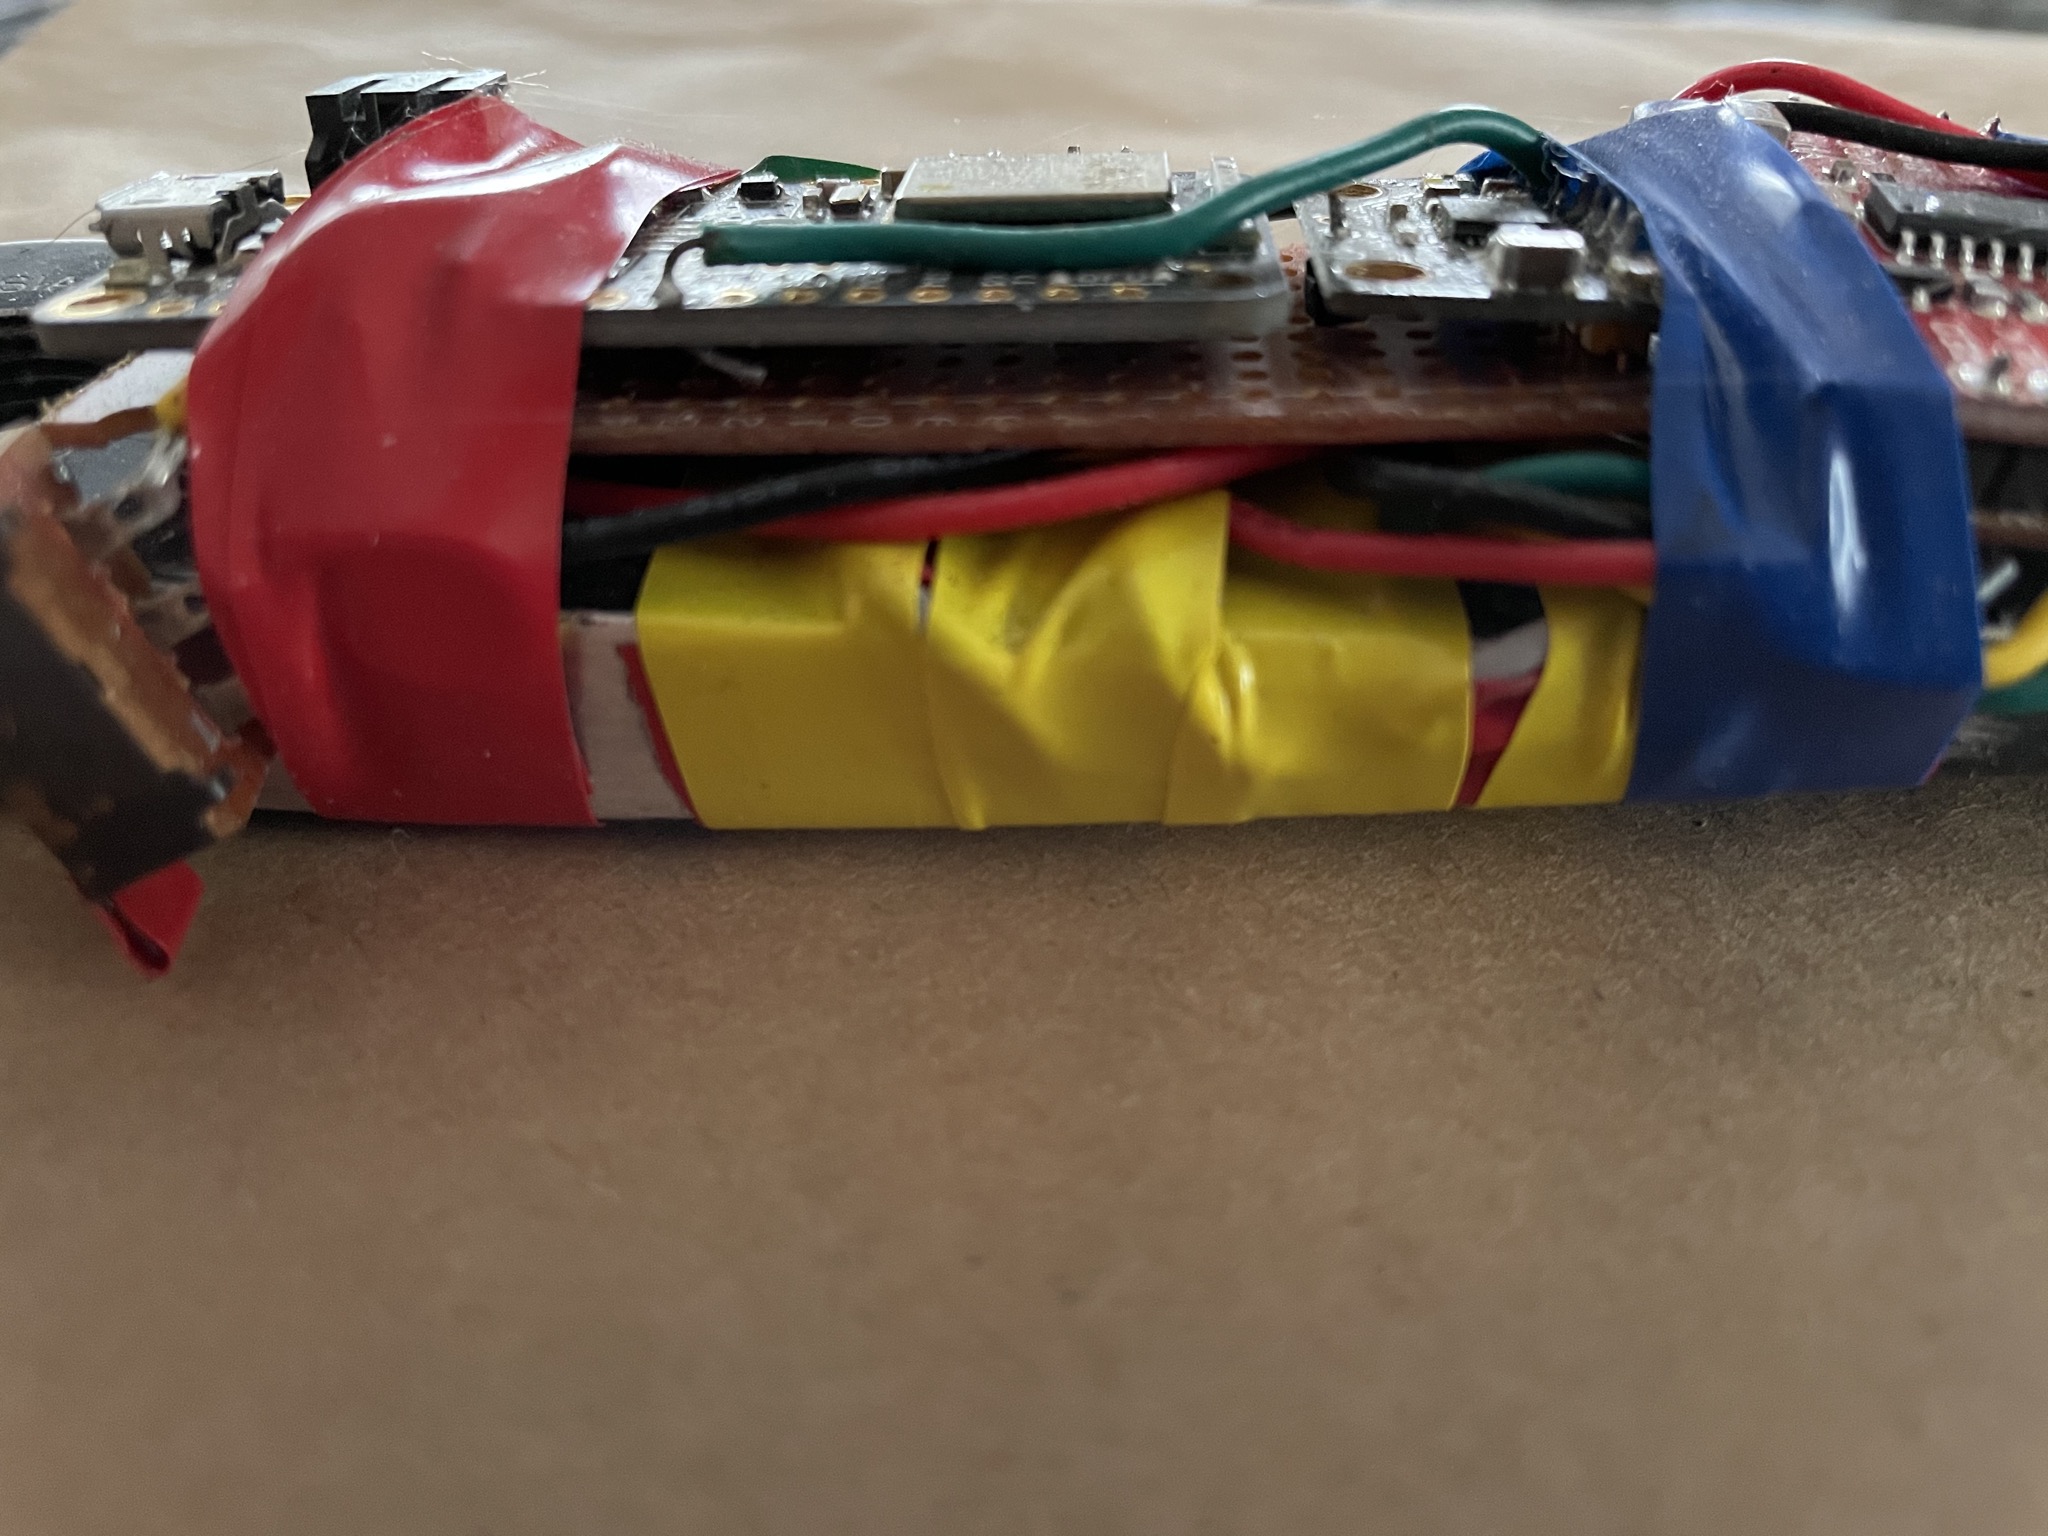
2. Waterproofing
Here’s a riddle: What behaves sporadically, probably requires a partial rebuild, and is a fair cause for panic when you’re 30 minutes from home and it starts to sprinkle? Right, it’s the wet bundle of exposed electronics you spent hours soldering by hand.
There are some simple solutions I thought would help – wrapping in plastic, duct tape, a 3d printed case, plastic and duct tape – but in my experience those don’t cut it. It worked well enough because it rarely rains in Colorado, but it didn’t take much moisture to require basically a rebuild.
3. Better Data Smoothing
Getting a power measurement was (by comparison) trivially simple. Getting a nice steady power measurement proved to be as much an art as a science. It’s natural for power output to be constantly moving as you’re riding, but in comparisons to commercial power meters, this DIY version is spikier.
To combat this I did some software tuning, like rolling weighted averages for both power and foot speed and throwing out outlier samples. But even so, the variance of this meter compared with Assioma Duo pedals was significantly higher. (I actually measured and graphed this with Python, given different GPX files, but looks like I’ve misplaced that data along the way…)
4. Auto On/Off
Right now there’s a simple toggle switch to turn it on and off. It’s real easy to forget to turn it off, and then it’ll be dead for your next ride. And it’d be a nicer user experience to automatically turn it on/off based on movement detection. We have the hardware to support that, it could be a thing.
5. Code Cleanup
The code is generally a bit messy. And the schematic and setup instructions aren’t descriptive enough to know “which way is up” until it’s all hooked up and you just see whether numbers are negative or positive (there is a nice hook in the code for that, though).
6. Make it Hardware
Really this one trumps all previous improvements; they’re marginal gains, this one’s a game-changer. We could take the (relatively few) pieces of the hardware we’re really using and turn them into custom hardware, in the form of a PCB/PCBA. The features and circuitry not needed would fall away, shrinking the physical size dramatically (we could fit it in a waterproof case) and not powering unnecessary board or module features would make power consumption much more efficient. This work really wouldn’t be in my wheelhouse, though.
(Thanks to Mike for bringing this up in the comments. ![]() )
)
Adios
If you find this helpful or hit any blockers, please let me know in the comments below, on the repo, or Tweet at me. I’d love a great reason to remember anything I’ve forgotten to help out.
Updates:
March 22, 2021 - Fixing some formula formatting. They weren’t wrong, just not… readable.
August 24, 2021 - Add PCB/hardware improvement to the list.
November 4, 2021 - Include graphs and clickable/zoomable photos in the post.
March 30, 2022 - Push mirror of repo to Github and change links to there instead of Gitlab. Just because it’s a more active open source scene.
Leave a Comment